In last week's Thoughtful Moment, we touched on the two surveys that provide us with the information you can find in the 2022-2023 AERR.
The provincial survey data, with a response rate of 5% of our parents in grades 4, 7 and 10 can be found on Page 10 of the AERR. This table shows this feedback and data, along with PAT and Diploma exam results.
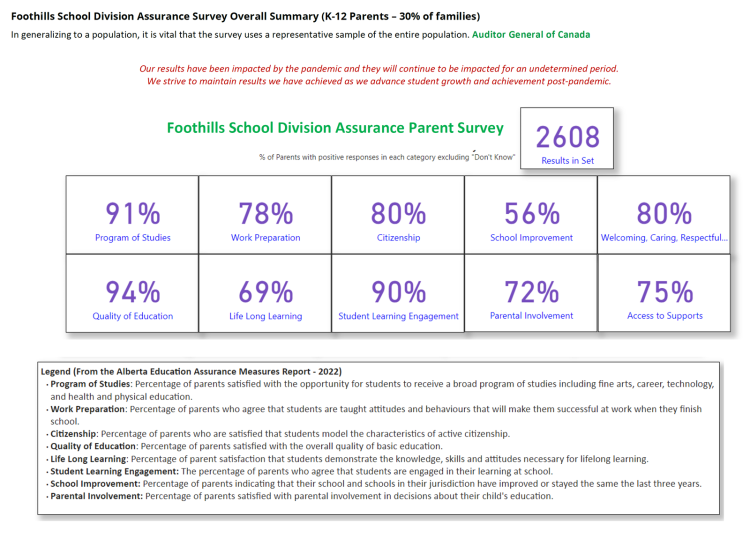
The local FSD Assurance Survey, with a response rate of 30% of our parents from K to 12 provides more in-depth information. The FSD survey uses the same questions, and it is more representative of our local context.
When we compare the results from the two surveys, we get a clear picture of the successes as well as the challenges at Foothills School Division. Page 11 the 2022-2023 AERR provides this comparison; highlighting four areas to be celebrated, and three areas for growth and improvement. These tables also provide comparative information for the last 4 years.

Page 10 of the 2022-2023 AERR
Our successes are found in the following areas:
Landing at 80% locally is Citizenship, 4.5% above the FSD provincial survey result, and equivalent to the provincial average. Safe, Caring and Welcoming schools is also at 80%, 2.7% and 4.8% below the provincial survey and the provincial average. Student Learning Engagement sits at 90% locally, 9% above the provincial survey, and 5.5% above the provincial average. And finally, Education quality sits at 94% locally! This is 8% above the provincial survey and 6% above the provincial average. This is to be celebrated. Our work and strategies are effective. But we cannot rest on our laurels and will certainly continue our work to find ways to have all measures reach 100%.
Our challenges are found in the following areas:
Access to Supports sits at 75%, 1% lower than the provincial survey and 4.5% below the provincial average. Parental Support rests at 72%, 3.5% lower than the provincial survey and 7% lower than the provincial average. The final measure is where we need to improve significantly. School Improvement is at 56%. This is 13% lower than the provincial survey and 19% below the provincial average. We need to roll up our sleeves and make greater progress with these measures, and School Improvement in particular.
The true value of the AERR is the story behind the numbers. What are the strategies we have in place? Are they working? How are we adjusting and what is next? This is the information you will find in the rest of the AERR. The stories of what is working, and what is not. And of the continued work we are doing to continue to improve and meet the needs of all our students and families. And to continue to provide a great place for all our employees to work.
Each of our schools has its own AERR. It will be available on the school website as of November 30. The stories from each of our schools contribute to the story of FSD and the FSD community. Enjoy our story of learning and the story of education at the centre of a flourishing community.


