
The Louis Riel School Division's (LRSD) Data Discovery Dashboard that allows the public to interact with data on student achievement. The public-facing web-based tool attempts to make data accessible and understandable to everyone in the LRSD community. It illuminates the effects of socio-economic status (SES) and the division's Greatest Areas of Need (GAN).
CLICK HERE TO VIEW THE DATA DISCOVERY DASHBOARD
The Data Discovery Dashboard was created by LRSD using Power BI, an analytics application by Microsoft that allows users to create an easy-to-navigate visual display of data. LRSD was recently recognized for its innovative approach to data by Microsoft in a global case study. By clicking through the various pages of the report, individuals can isolate data based on skill, gender, grade level and more.
"We are trying to always use data as a flashlight, rather than a hammer," said Marnie Wilson, Data Literacy Coordinator in LRSD. "It's not about competition or comparison, but rather what can it tell us so that we better know how to improve."
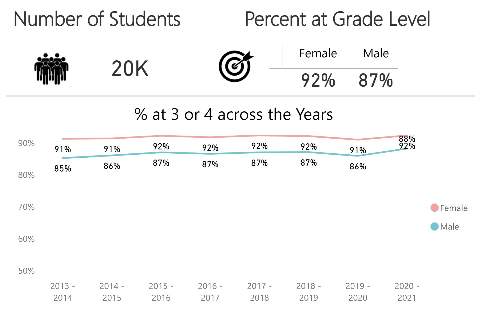
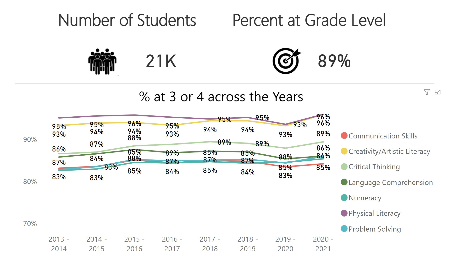
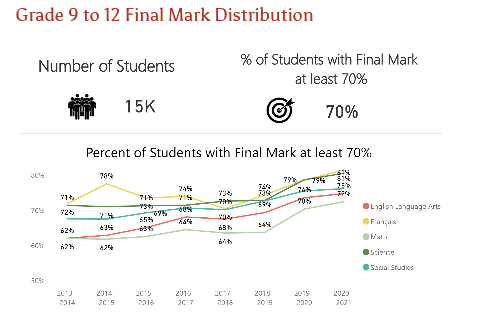
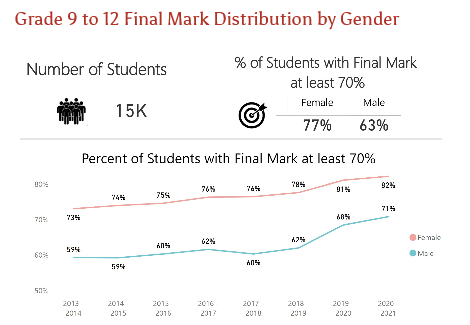
The division has been measuring the impact of the strategic priorities related to student learning and well-becoming outlined in its Multi-Year Strategic Plan. The LRSD Data Discovery Dashboard is a high-level summary of that measurement and presents the progress of future-ready skills among learners. The data show the percentage of students in grades 1 to 8 who scored a 3 (good) or 4 (very good or excellent) on the final term of the provincial report card and students in grades 9 to 12 who achieved a final mark of 70% or higher in core courses.
"LRSD's data literacy focus seeks to continuously improve the validity and reliability of reporting student progress on the Manitoba report card," said Christian Michalik, Superintendent. "We believe this focus better serves students than a focus on PISA, PCAP or a grade-level standards tests."
This June, graduating students are leaving with two documents in hand: a diploma and a transcript. That transcript is the only summary of a thirteen-year learning journey and is their passport to continued learning that leads to a career. Accordingly, LRSD strives to bring together teachers to focus on the evidence that makes up a final grade on an LRSD report card to ensure greater validity and reliability. That learning journey needs to be our focus, not an international norming study, not a national norming study, not a narrow grade-specific standards test. Ultimately, LRSD wants the greatest number of students in grades 1 to 8 to achieve a 3 or a 4 as final grade on the report card and students in grades 9 to 12 a final mark of 70% or higher. These are our bold and audacious targets.
Looking to the skills with the lowest percentage of students attaining proficiency of a 3 or 4, the division's GANs for students in grades 1 to 8 is writing, followed by problem solving in mathematics. The data also shows that SES has a consistent effect on student achievement. In every skill, students in grades 1 to 8 from lower SES catchments are less likely to obtain a 3 or 4; however, the gap is steadily closing.
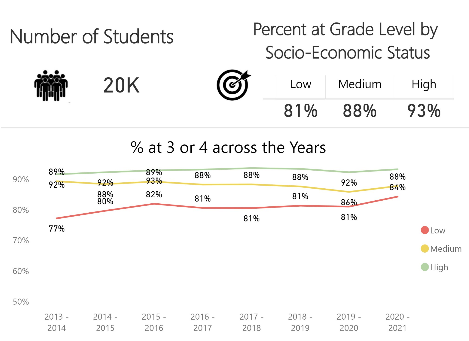
"Understanding where gaps exist directly impacts our decision making," said Michalik. "Looking to the current data, one can deduce that our work to provide equitable access to supports has been helping improve student outcomes; however, more work is clearly necessary to ensure all students can thrive and flourish in LRSD."
While the public Data Discovery Dashboard provides a snapshot of high-level data, as part of its MYSP, LRSD also launched more detailed divisional and school-specific reports that allow staff to quickly gain insight into student achievement and engagement, recovery learning, attendance, technology deployment and more.
"More than 90 per cent of classroom teachers, student services teachers, and school administrators agreed that Power BI reports will be helpful in supporting tasks such as planning for instruction, identifying students in need of extra supports, making recommendations for class placements and supporting report card writing," said Clarke Hagan, Director of Information Technology Systems. "The hope is that Power BI reports become commonplace in classrooms throughout LRSD."
The launch of the Data Discovery Dashboard and focus on Power BI is part of LRSD's Data Literacy Initiative; the division's journey to develop the data literacy of students, staff and families, grounded in ethical data stewardship.
Moving into the 2021-2022 school year and beyond, LRSD will continue its focus on data literacy to effectively identify improvement, successes and needs. Further developing and implementing research-informed teaching practice and learning theory will also be important to remaining responsive to students' specific needs.
"This journey to improvement must be co-created alongside students to ensure they are empowered to self-monitor and adjust their pace and path," said Michalik. "If this work is connected to the development of greater intercultural understanding, compassion, and mutual respect, then our most vulnerable students will experience positive changes in achievement, engagement, and well-becoming."